From operational data to decisions.
Semantic layers, dashboards and forecasting that leadership actually opens.
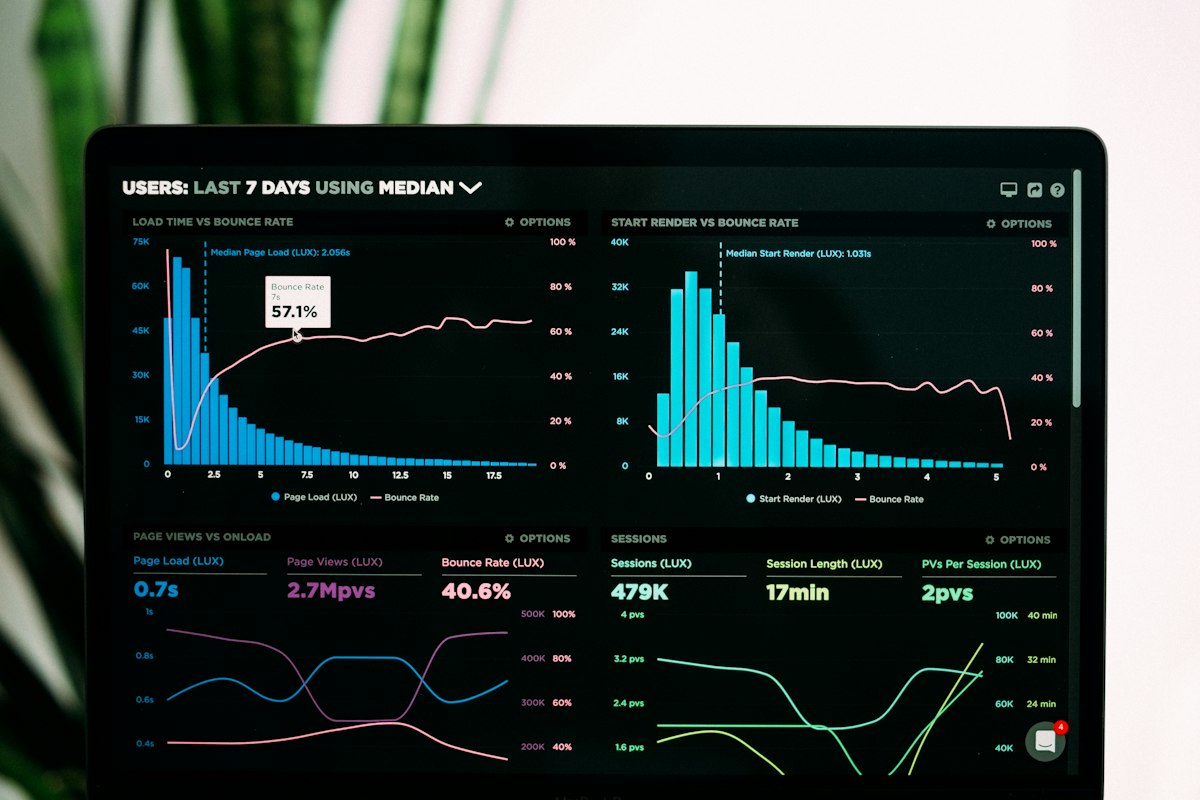
What we build
Semantic layers
One definition of every metric, so every dashboard tells the same story.
Dashboards
Built around the decisions people make, not the data that happens to exist.
Forecasting
Demand, capacity and revenue forecasts with their uncertainty shown.
Self-serve analytics
Governed access so teams answer their own questions safely.
How it's architected
ERP, CRM, finance and operational systems.
- SQL Server
- PostgreSQL
Tested, documented transformations.
- dbt
Metrics defined once and reused everywhere.
- dbt
- Power BI
Reports people open every morning.
- Power BI
Models that look forward, not only back.
- Python / FastAPI
- MLflow
Faster, better-informed decisions across the business.
Typical engagements
Metrics reset
One agreed set of KPIs, defined and automated.
BI modernisation
Legacy reports rebuilt on a governed semantic layer.
Forecasting
A forecasting capability built on the data you already have.
Where we apply it

Have a complex problem?Let's engineer the solution.
Tell us what you're trying to build, improve, automate or understand. We'll help you find the technology path forward.